In July 2022, within the framework of the Carbon Disclosure Project was published a Climate Questionnaire for 2021 which includes data on the volumes of direct and indirect greenhouse gas emissions for all KMG assets, including subsidiaries in Romania and Georgia.
According to the report, based on the results of 2021 the volume of direct carbon dioxide emissions in the KMG Group of Companies amounted to 6.9 mln tons of CO2 (10.6 mln tons of CO2-equiv.). The CO2-equiv. data are presented using potential coefficients of the global warming IPCC Fifth Assessment Report (methane – 28, nitrous oxide – 265). The calculation includes carbon dioxide (CO2), methane (CH4), nitrous oxide (N2O). The data on direct greenhouse gas emissions are confirmed by the conclusions of independent certified organizations for each SDE.
The information for 2022 will be disclosed in the CDP report in III-d quarter 2023. When disclosure of information we adhere to the principle of consistency and comparability. We continuously work to improve the completeness of disclosure of information.
CDP questionnaires can be found at the following link: https://www.kmg.kz/en/investors/reporting/?TYPE=report_development
The volume of direct GHG emissions (CO2) emissions for 2022 by the KMG Group of Companies amounted to 7.6 mln tons CO2 (8.1 mln tons of CO2-equiv.)20.
20 Information for 2021 and 2022 in the Report on this indicator represent only KMG Group, except for KTG. Data for 2020 are given taking into account KTG.
|
Coverage 1. Direct emissions |
2020 |
2021 |
2022 |
|
|
Breakdown by areas of activity |
|
|
|
|
|
Production |
mln tons СО2/ mln tons СО2-equiv |
2.0/4.1 |
2.2/4.3 |
2.4/2.8 |
|
Refining |
mln tons СО2/ mln tons СО2-equiv |
4.6/6.2 |
4.5/6.1 |
5.1/5.2 |
|
Transportation |
mln tons СО2/ mln tons СО2-equiv |
2.1/5.5 |
0.2/0.2 |
0.1/0.1 |
|
Breakdown by country |
||||
|
Kazakhstan |
mln tons СО2/ mln tons СО2-equiv |
7.8/14.9 |
6.2/9.9 |
6.6/7.1 |
|
Romania |
mln tons СО2/ mln tons СО2-equiv |
0.9/0.9 |
0.7/0.7 |
0.9/0.9 |
|
Georgia |
mln tons СО2/ mln tons СО2-equiv |
0.01/0.01 |
0.01/0.01 |
0.02/0.02 |
|
Breakdown of emissions by type of greenhouse gases |
||||
|
СО2 |
mln tons СО2 |
8.7 |
6.9 |
7.6 |
|
CH4 |
mln tons СО2-equiv |
6.6 |
3.2 |
0.4 |
|
N20 |
mln tons СО2-equiv |
0.5 |
0.5 |
0.1 |
|
Coverage 2. Indirect emissions (market method) |
mln tons СО2/ mln tons СО2-equiv |
3.6/3.5 |
3.3/3.3 |
The information will be disclosed in III-d quarter 2023 in the Climate Questionnaire. |
|
Level 2. Indirect emissions (geographical method) |
mln tons СО2/ mln tons СО2-equiv |
3.5/3.5 |
3.3/3.3 |
|
|
Coverage 3. Emissions from the use of sold products |
mln tons СО2/ mln tons СО2-equiv |
61.1/61.3 |
61.9/62.1 |
|
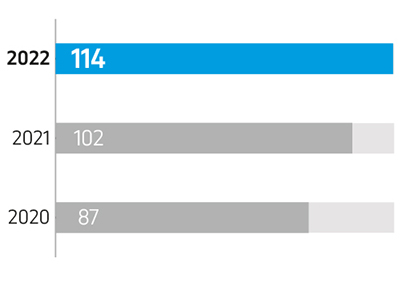
The indicator of the intensity of CO2 emissions was 114 tons CO2 per 1,000 tons of extracted crude hydrocarbons, which is 4 % lower than the industry average of the International Association of Oil and Gas Producers (IOGP), which is 119.
Intensity of CO2 emissions (tons/1,000 tons of produced HCs)
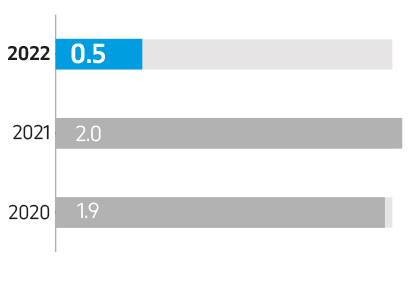
Intensity of CH4 emissions (tons/1,000 tons of produced HCs)
The increase in the intensity of CO2 emissions is associated with the exit to full capacity of power generation sources. For information, the industry average indicator of the intensity of CO2 emissions presented by the IOGP also increased from 113 to 119 tons CO2 per 1,000 tons of produced HCs over the year.
A significant decrease in the intensity of CH4 emissions is associated with a change in the methodology for methane emissions calculation at the national level.
In its activities, the Company does not emit ozone-damaging substances that affect climate change. Periodic inspection control and monitoring are carried out.
Ecological indicators
|
|
Production |
Transportation |
Refining |
||||||
|
2020 |
2021 |
2022 |
2020 |
2021 |
2022 |
2020 |
2021 |
2022 |
|
|
Greenhouse gas (GHG) emissions |
|
|
|
|
|
|
|
|
|
|
Direct GHG emissions (CO2, mln tons) |
2.0 |
2.2 |
2.4 |
2.1 |
0.2 |
0.1 |
4.6 |
4.5 |
5.1 |
|
GHG emission intensity (tons CO2 per 1,000 tons HCs) |
87 |
102 |
114 |
|
|
|
248 |
226 |
236 |
|
APG combustion |
|
|
|
– |
– |
– |
– |
– |
– |
|
Flaring (mln tons CO2) |
0.13 |
0.11 |
0.09 |
– |
– |
– |
– |
– |
– |
|
Intensity of associated gas combustion (tons per 1,000 tons of produced HCs) |
2.2 |
2.1 |
1.5 |
– |
– |
– |
– |
– |
– |
|
Flaring (mln m3) |
57.6 |
52.5 |
35.7 |
– |
– |
– |
– |
– |
– |