Oil and Gas Production
Key indicators
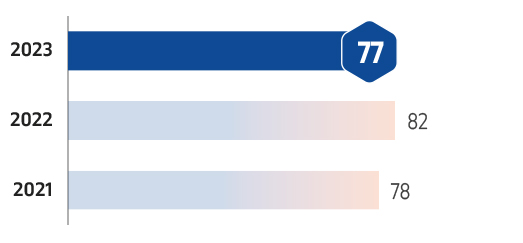
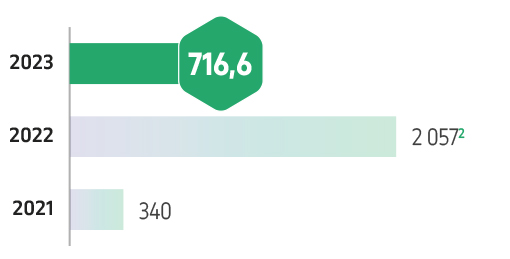
PRMS Reserves,
Category 2P
Mtoe

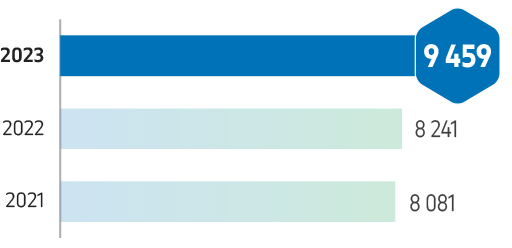
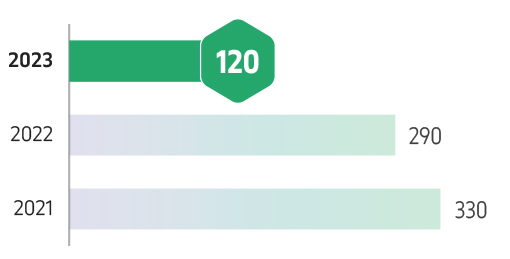
Oil and
Condensate
thous. tonnes

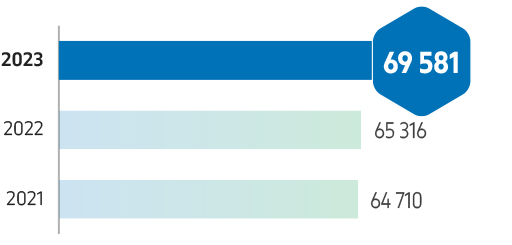
Natural and
Associated Gas
mln m3
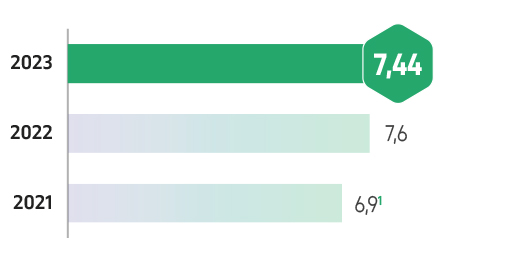
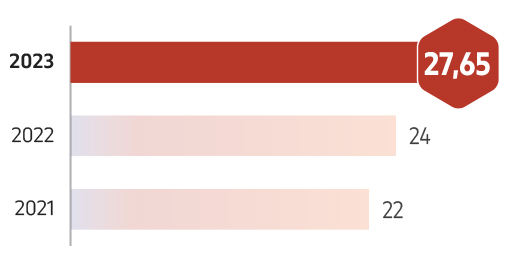
CO2 Emission Rate1
tonne per 1,000 tonnes of HCs
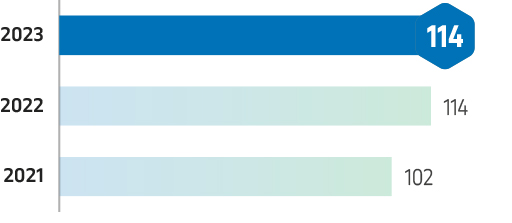
1
Intensity of CO2 emissions per 1,000 tonnes of produced HCs
Oil
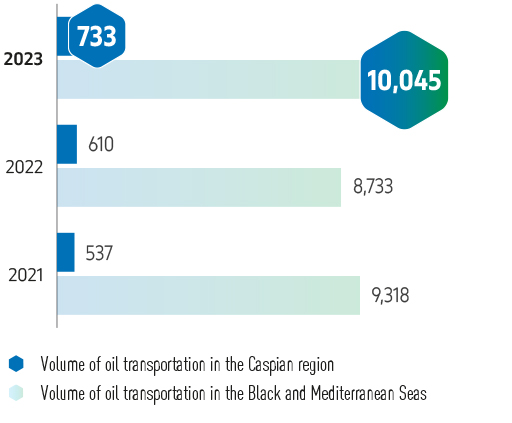
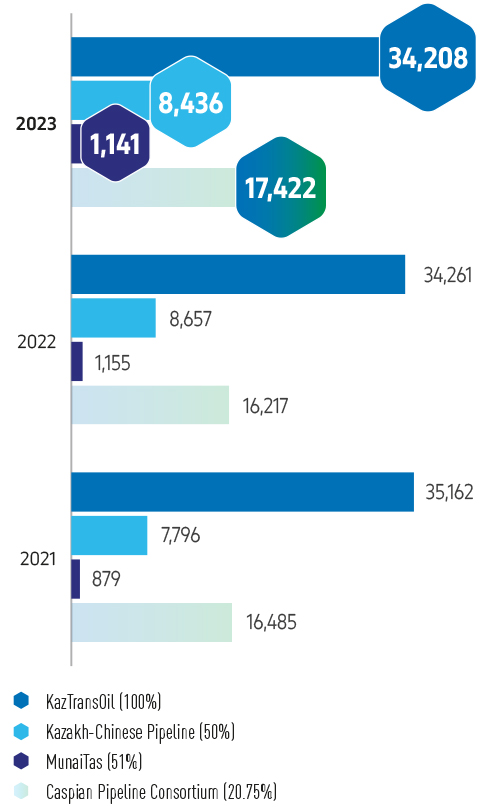
Transportation
Key indicators
Volume of oil transportation per KMG share
1,thous. tonnes
SEA OIL TRANSPORTATION
VOLUME
thous. tonnes
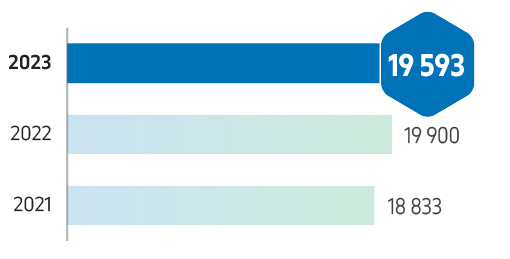
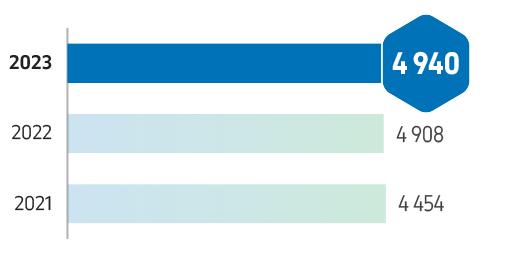
Oil turnover per KMG
share
2,mln tonnes * km
1
1 Consolidated oil transportation volume takes into account the transportation volume of each individual pipeline company, taking into account KMG’s operating share (excluding KTO). Some oil volumes may be transported by two or three pipeline companies and, accordingly, these volumes are accounted for more than once in the consolidated oil transportation volume.
2
2 Oil turnover of each individual pipeline company is calculated taking into account the operating share of KMG (excluding KTO).
Processing and Marketing
Key indicators
Oil and gas
processing
thous. tonnes
Wholesale sales of KMG oil products produced in the Republic of Kazakhstan
thous. tonnes
Service

Land transport, including cargo and passenger transportation, logistics and process
support for fields

Offshore operations support

Oil and gas well drilling and development

Well servicing and workover

Oil and gas equipment manufacturing

Process automation

Maintenance of measuring instruments, automation and telemechanics systems, provision of telecommunication, radio communication and cable and satellite television services at oilfields; inspection and repair of measuring instruments; maintenance of security alarms

Oil spill response services

Extraction and transportation of potable water, transportation of sea water

Catering and maintenance of social facilities, etc.
Environmental Responsibility
Key indicators
Water withdrawal
,mln m3
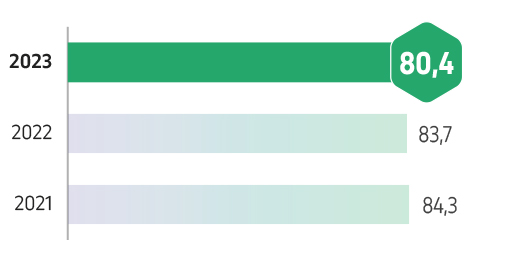
Associated petroleum gas utilisation
%
CO2 emissions
mln tonnes
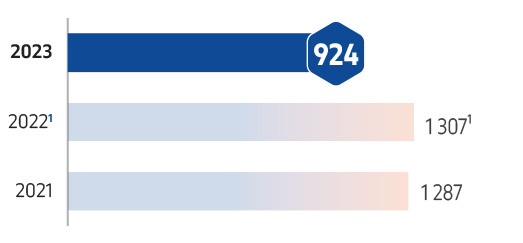
Disposal of historical waste
thous. tonnes
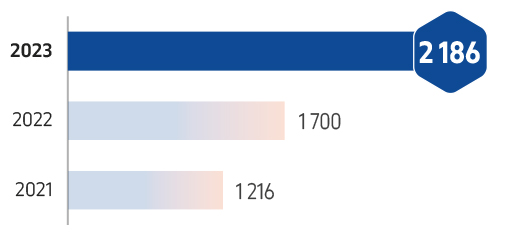
Energy saving
,thous. GJ
Onshore oil
spills
tonnes
Social Responsibility and OHS Indicators
Key indicators
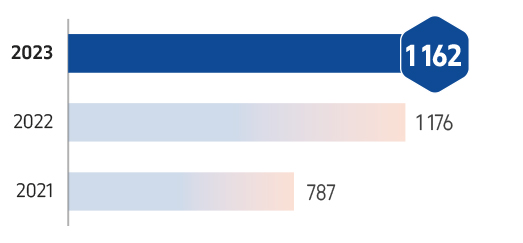
Social assistance
to employees
KZT bln
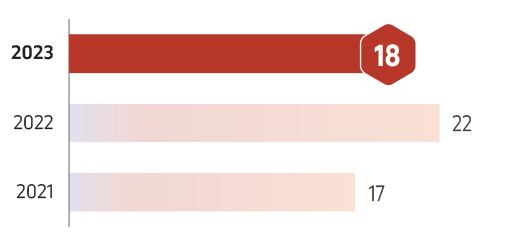
Employee turnover
%
Employees
by gender
%

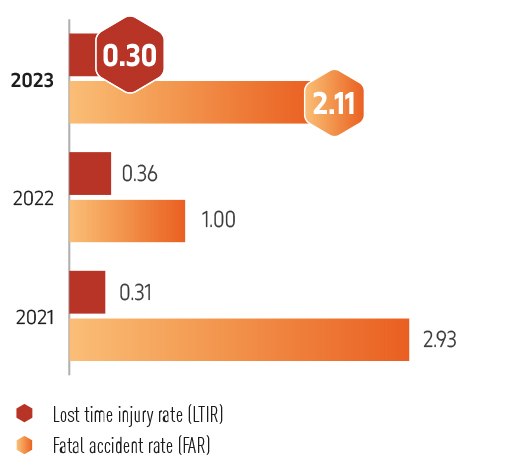
LTIR AND FAR RATES
OF EMPOLOYEES
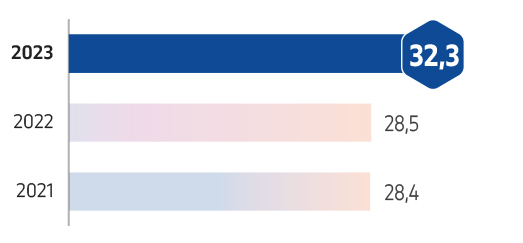
Average academic hours of training per year Per employee
Governance
Key indicators
ESG risk ratingмлн т н.э.
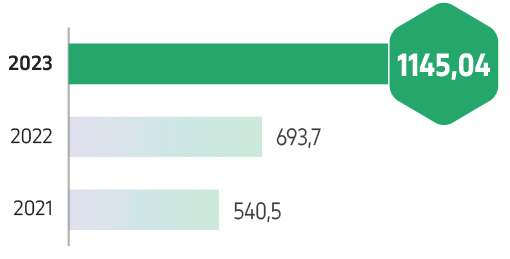
Taxes2,KZT bln
ProfitKZT bln
Procurement3,KZT bln
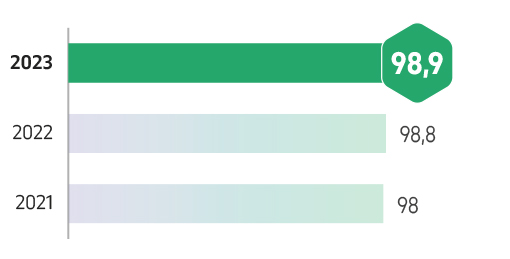
Local content in procurement
%